모니터링
Prometheus /w Grafana
# Prometheus 메트릭 수집 활성화
calicoctl patch felixconfiguration default --patch '{"spec":{"prometheusMetricsEnabled": true}}'
# calico-node의 메트릭 수집용 서비스 생성
k apply -f - <<EOF
apiVersion: v1
kind: Service
metadata:
name: calic-node-metrics-svc
namespace: kube-system
spec:
clusterIP: None
selector:
k8s-app: calico-node
ports:
- port: 9091
targetPort: 9091
EOF
# calico-controller의 메트릭 수집용 서비스 생성
k apply -f - <<EOF
apiVersion: v1
kind: Service
metadata:
name: calico-controllers-metrics-svc
namespace: kube-system
spec:
clusterIP: None
selector:
k8s-app: calico-kube-controllers
ports:
- port: 9094
targetPort: 9094
EOF
# 모니터링용 네임스페이스 및 서비스 계정 생성
k create -f -<<EOF
apiVersion: v1
kind: Namespace
metadata:
name: calico-monitoring
labels:
app: ns-calico-monitoring
role: monitoring
EOF
k apply -f - <<EOF
apiVersion: rbac.authorization.k8s.io/v1
kind: ClusterRole
metadata:
name: calico-prometheus-user
rules:
- apiGroups: [""]
resources:
- endpoints
- services
- pods
verbs: ["get", "list", "watch"]
- nonResourceURLs: ["/metrics"]
verbs: ["get"]
---
apiVersion: v1
kind: ServiceAccount
metadata:
name: calico-prometheus-user
namespace: calico-monitoring
---
apiVersion: rbac.authorization.k8s.io/v1
kind: ClusterRoleBinding
metadata:
name: calico-prometheus-user
roleRef:
apiGroup: rbac.authorization.k8s.io
kind: ClusterRole
name: calico-prometheus-user
subjects:
- kind: ServiceAccount
name: calico-prometheus-user
namespace: calico-monitoring
EOF
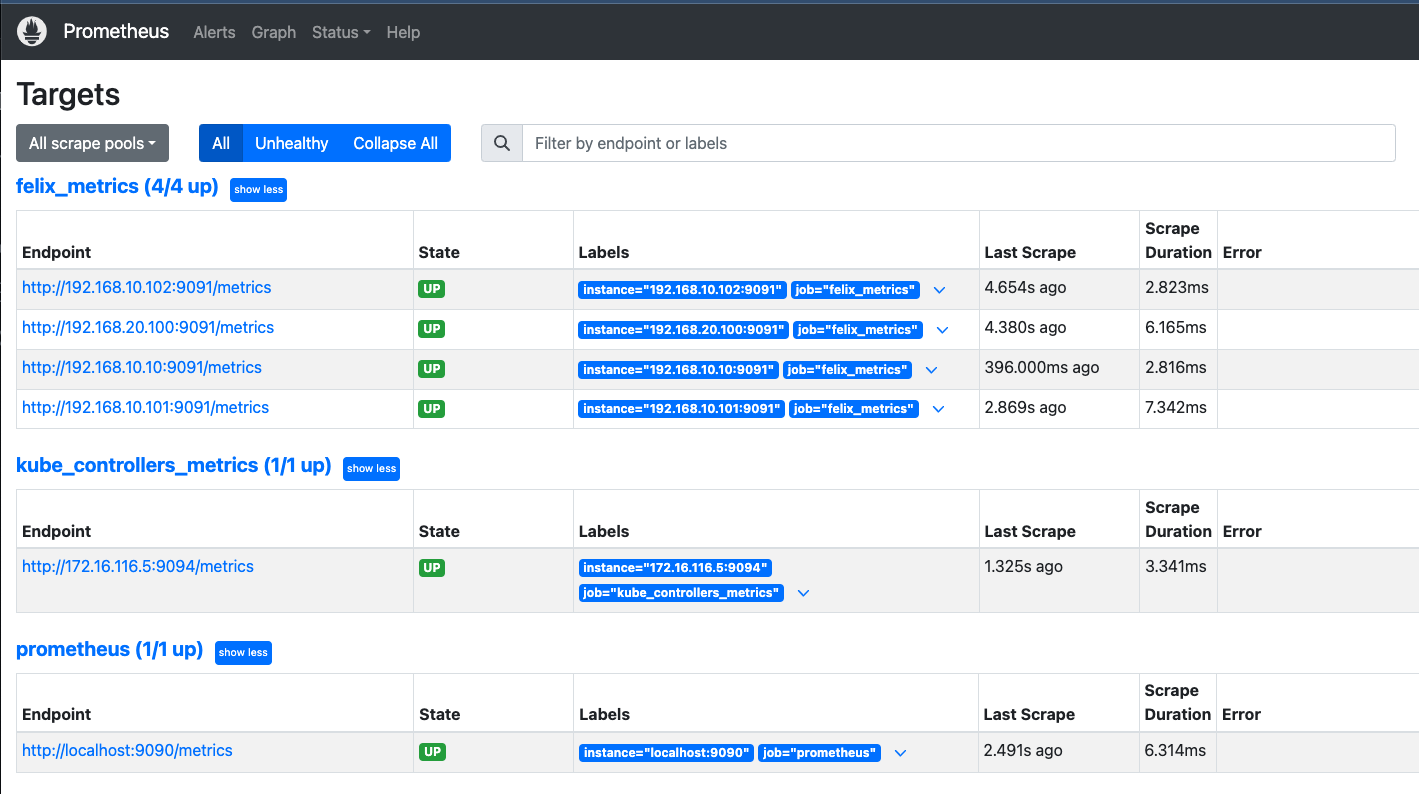
# prometheus용 설정 파일 구성 및 배포
k apply -f - <<EOF
apiVersion: v1
kind: ConfigMap
metadata:
name: prometheus-config
namespace: calico-monitoring
data:
prometheus.yml: |-
global:
scrape_interval: 15s
external_labels:
monitor: 'tutorial-monitor'
scrape_configs:
- job_name: 'prometheus'
scrape_interval: 5s
static_configs:
- targets: ['localhost:9090']
- job_name: 'felix_metrics'
scrape_interval: 5s
scheme: http
kubernetes_sd_configs:
- role: endpoints
relabel_configs:
- source_labels: [__meta_kubernetes_service_name]
regex: calic-node-metrics-svc
replacement: $1
action: keep
- job_name: 'felix_windows_metrics'
scrape_interval: 5s
scheme: http
kubernetes_sd_configs:
- role: endpoints
relabel_configs:
- source_labels: [__meta_kubernetes_service_name]
regex: felix-windows-metrics-svc
replacement: $1
action: keep
- job_name: 'typha_metrics'
scrape_interval: 5s
scheme: http
kubernetes_sd_configs:
- role: endpoints
relabel_configs:
- source_labels: [__meta_kubernetes_service_name]
regex: typha-metrics-svc
replacement: $1
action: keep
- job_name: 'kube_controllers_metrics'
scrape_interval: 5s
scheme: http
kubernetes_sd_configs:
- role: endpoints
relabel_configs:
- source_labels: [__meta_kubernetes_service_name]
regex: calico-controllers-metrics-svc
replacement: $1
action: keep
EOF
k apply -f - <<EOF
apiVersion: v1
kind: Pod
metadata:
name: prometheus-pod
namespace: calico-monitoring
labels:
app: prometheus-pod
role: monitoring
spec:
nodeSelector:
kubernetes.io/os: linux
serviceAccountName: calico-prometheus-user
containers:
- name: prometheus-pod
image: prom/prometheus
resources:
limits:
memory: "128Mi"
cpu: "500m"
volumeMounts:
- name: config-volume
mountPath: /etc/prometheus/prometheus.yml
subPath: prometheus.yml
ports:
- containerPort: 9090
volumes:
- name: config-volume
configMap:
name: prometheus-config
EOF
# prometheus 서비스 생성
k apply -f - <<EOF
apiVersion: v1
kind: Service
metadata:
name: prometheus-dashboard-svc
namespace: calico-monitoring
spec:
type: NodePort
selector:
app: prometheus-pod
role: monitoring
ports:
- protocol: TCP
port: 9090
targetPort: 9090
nodePort: 30001
EOF
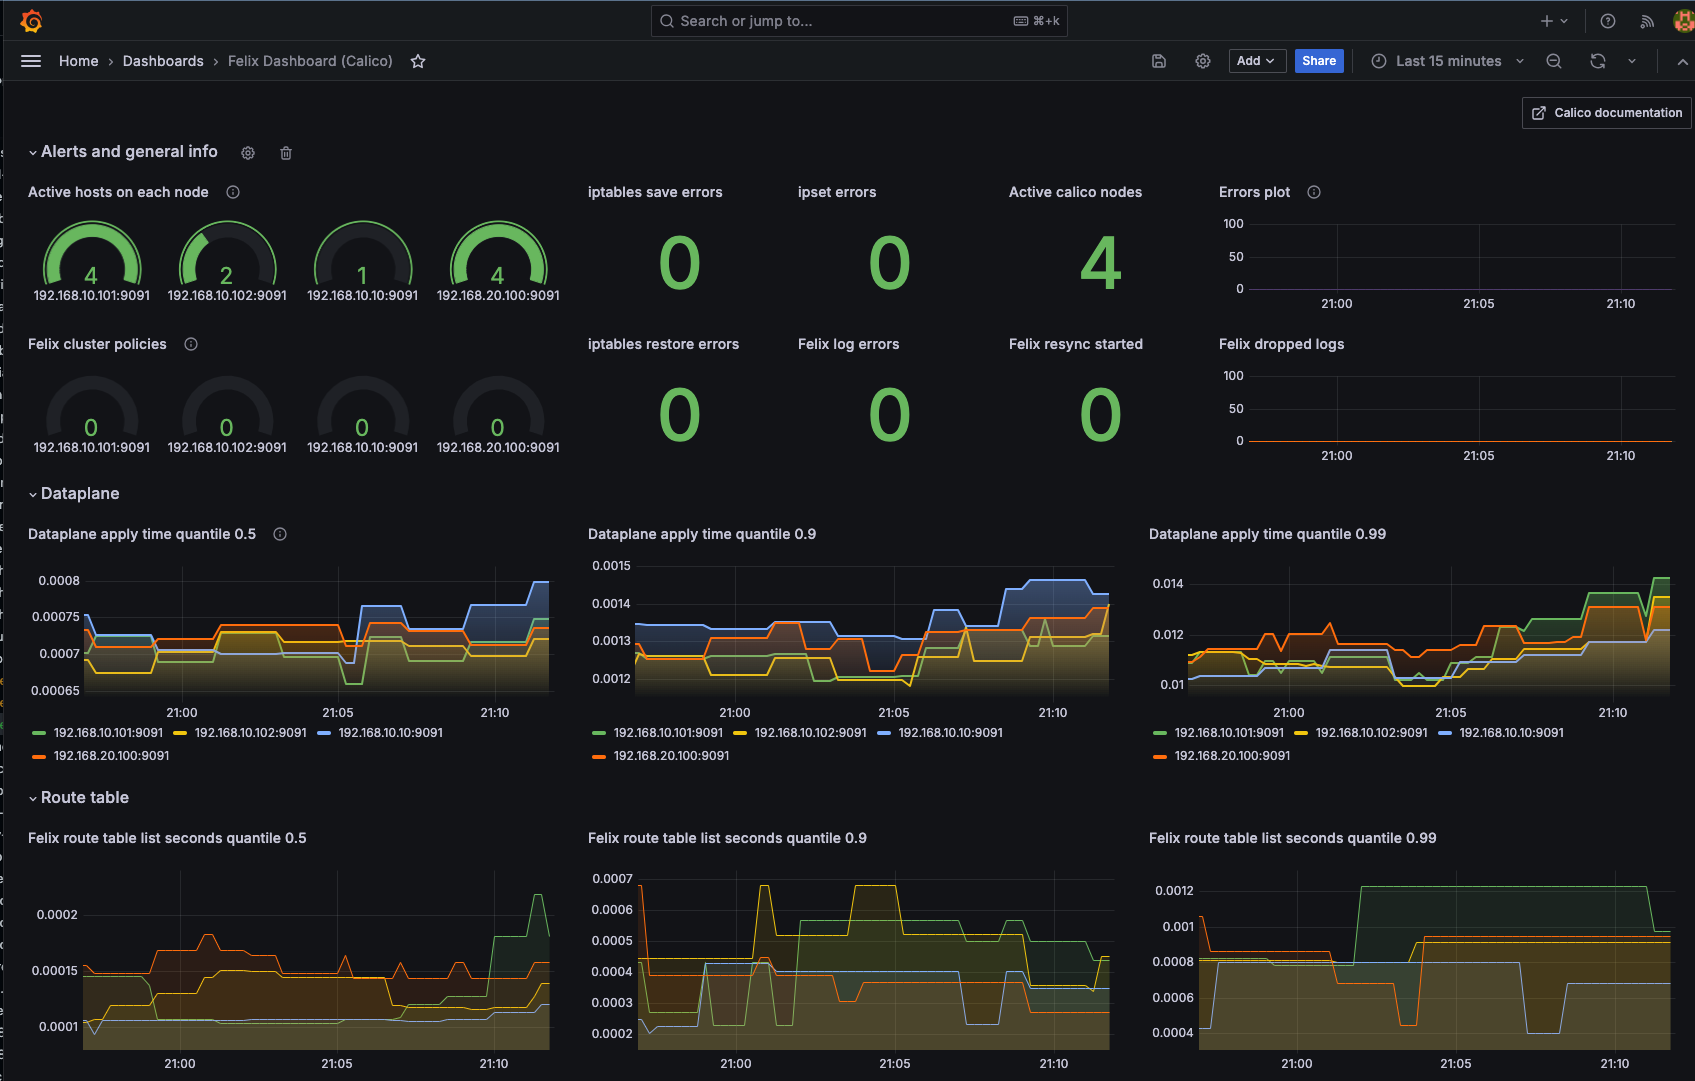
# Grafana 구성
k apply -f - <<EOF
apiVersion: v1
kind: ConfigMap
metadata:
name: grafana-config
namespace: calico-monitoring
data:
prometheus.yaml: |-
{
"apiVersion": 1,
"datasources": [
{
"access":"proxy",
"editable": true,
"name": "calico-demo-prometheus",
"orgId": 1,
"type": "prometheus",
"url": "http://prometheus-dashboard-svc.calico-monitoring.svc:9090",
"version": 1
}
]
}
EOF
# Calico용 대시보드 샘플
k apply -f https://raw.githubusercontent.com/projectcalico/calico/v3.28.1/manifests/grafana-dashboards.yaml
# Grafana POD 배포
k apply -f - <<EOF
apiVersion: v1
kind: Pod
metadata:
name: grafana-pod
namespace: calico-monitoring
labels:
app: grafana-pod
role: monitoring
spec:
nodeSelector:
kubernetes.io/os: linux
containers:
- name: grafana-pod
image: grafana/grafana:latest
resources:
limits:
memory: "128Mi"
cpu: "500m"
volumeMounts:
- name: grafana-config-volume
mountPath: /etc/grafana/provisioning/datasources
- name: grafana-dashboards-volume
mountPath: /etc/grafana/provisioning/dashboards
- name: grafana-storage-volume
mountPath: /var/lib/grafana
ports:
- containerPort: 3000
volumes:
- name: grafana-storage-volume
emptyDir: {}
- name: grafana-config-volume
configMap:
name: grafana-config
- name: grafana-dashboards-volume
configMap:
name: grafana-dashboards-config
EOF
# Grafana 서비스 배포
k apply -f - <<EOF
apiVersion: v1
kind: Service
metadata:
name: grafana
namespace: calico-monitoring
spec:
type: NodePort
selector:
app: grafana-pod
role: monitoring
ports:
- protocol: TCP
port: 3000
targetPort: 3000
nodePort: 30002
EOF
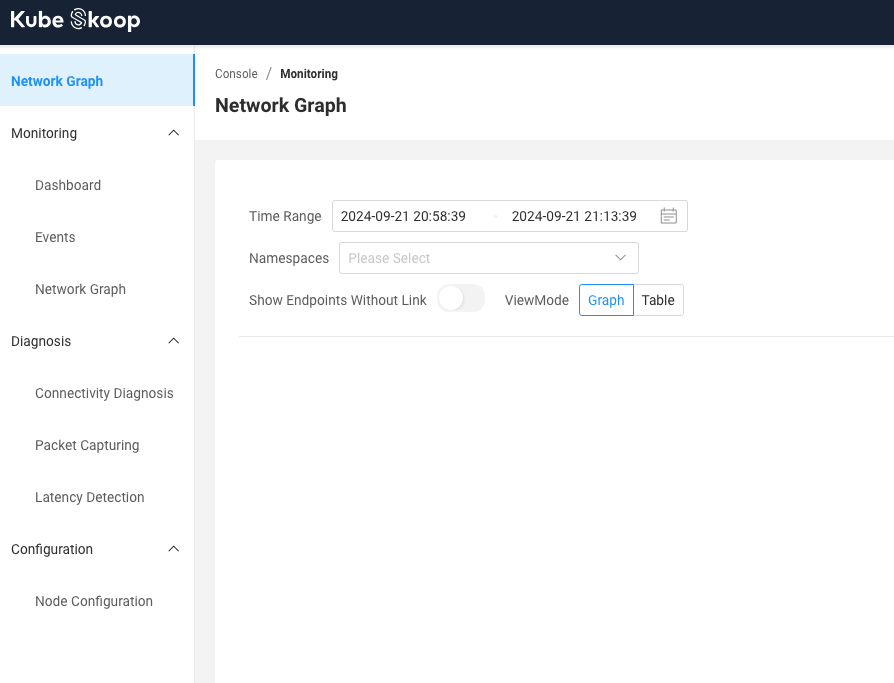
Kubeskoop
# yaml 배포
k apply -f https://raw.githubusercontent.com/alibaba/kubeskoop/main/deploy/skoopbundle.yaml

# 서비스를 노드포트로 패치
k patch service -n kubeskoop webconsole -p '{"spec": {"type": "NodePort"}}'